Energy Management System for Multifamily Sites

A January gas bill arrives higher than expected at a mixed-use building, yet residents are still reporting cold bedrooms. The property manager can see the total cost, but not whether the cause is weather, a faulty control, a vacant suite, a meter gap or heat escaping through the building envelope. That's the kind of problem an energy management system should help solve.
For a multifamily property, the job isn't just to display kilowatt-hours. It's to build trustworthy whole-building records, connect energy use to building operations, and check that any savings preserve comfort.
Table of Contents
- What an Energy Management System Does in a Building
- Connect Submeters to Trustworthy Building Data
- KPIs for a Multifamily Energy Management System
- How to Plan and Implement the System
- Measure Comfort Alongside Every Savings Claim
- Prove Savings Without Cutting Comfort
- Book a Building Assessment Before You Specify Software
What an Energy Management System Does in a Building
At a 120-suite mixed-use building, the January gas bill jumps while some residents say their bedrooms are cold. A monthly bill shows that the building used more gas, but it can't tell the property manager whether the heating schedule changed, a control failed, or some suites are not getting enough heat.
An energy management system is a repeating cycle of inventory, measurement, analysis, action and review. It combines utility records, meter readings, building conditions and operating decisions, then checks whether the changes improved performance. It isn't a software screen by itself.
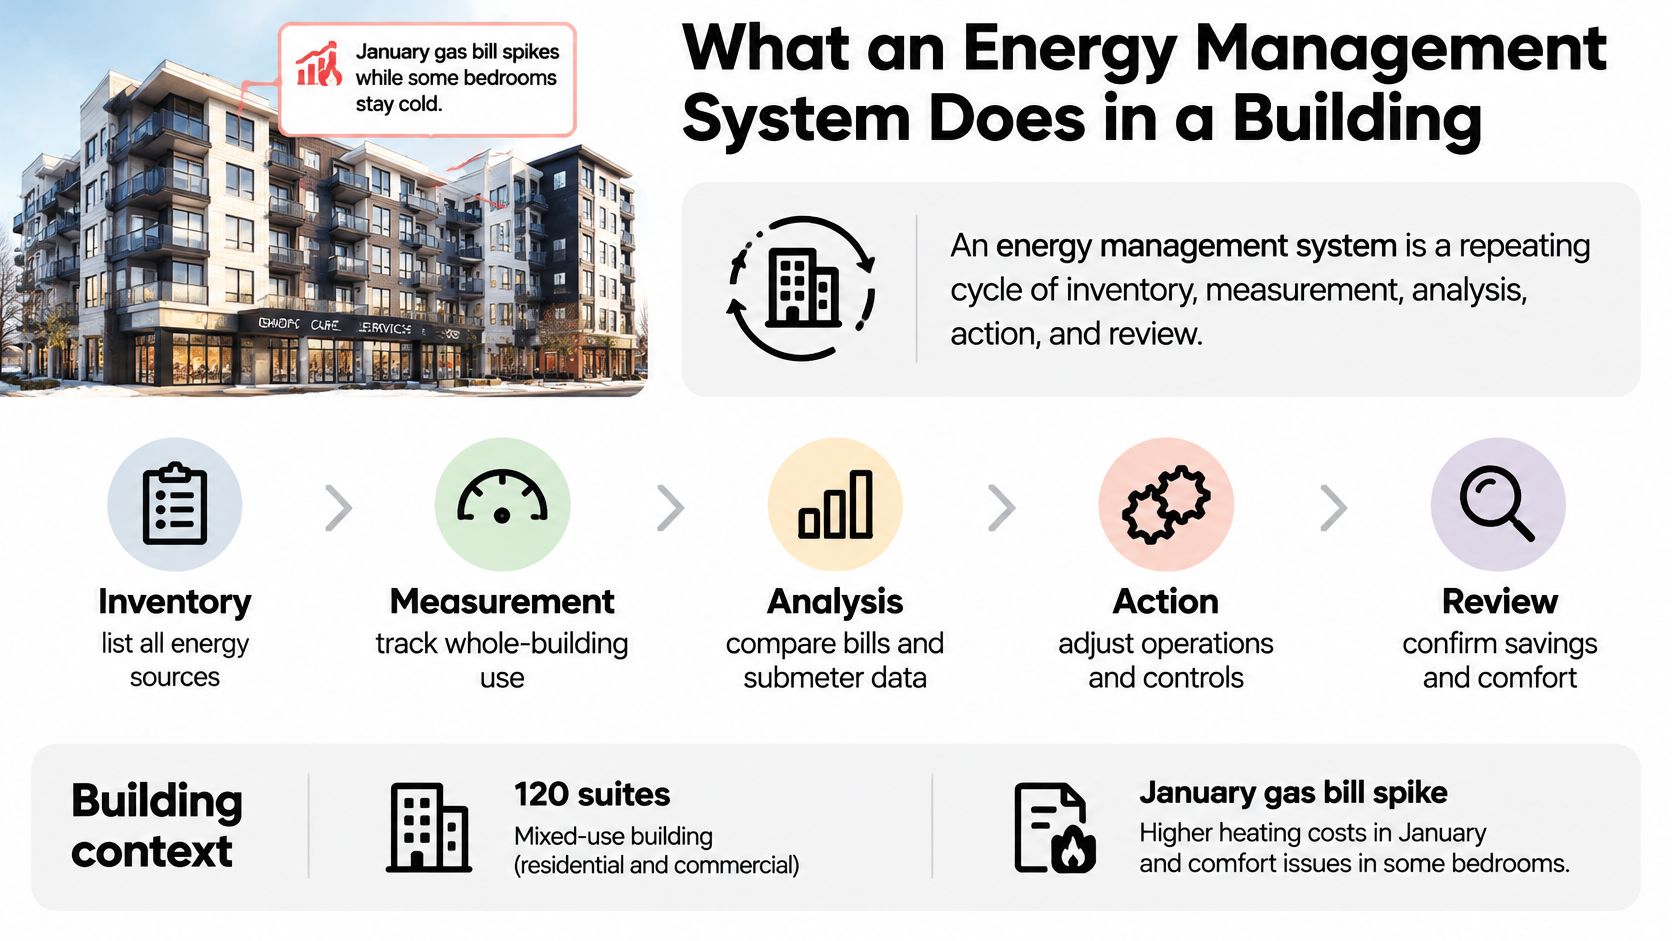
Heating is the practical test
Heating is where a Canadian building's energy management work often meets its hardest trade-off: reduce avoidable use without leaving people cold. Natural Resources Canada's 2025–2026 Energy Fact Book reports that space heating accounted for 56% of commercial and institutional building energy use in 2022, with water heating adding 6%. It also notes that fossil-fuel equipment used for space and water heating produced more than 96% of building operating emissions.
That makes a lower energy chart an incomplete result. In the Canadian government research cited in the fact book, data-driven supervisory controls reduced heating energy costs by 22% and greenhouse-gas emissions by 73% without compromising thermal comfort. Cooling-system controls reduced electricity consumption by 19%. The lesson for a property manager is to evaluate both the energy carrier and the conditions residents experience, rather than treating any drop in consumption as success.
A gas-heated building will show heating changes mainly on the gas meter. An electrically heated building, including one with heat pumps, may show them on the electricity meter instead. The same control strategy can therefore affect different readings, and the right measurement depends on the equipment.
A sound system starts with a meter hierarchy, then uses a scorecard, a practical implementation sequence and a comfort check. It also needs safeguards against false savings. If the building needs envelope improvements as well as better controls, this guide to exterior upgrades that help save energy can help owners consider measures that reduce heat loss at the building boundary.
Connect Submeters to Trustworthy Building Data
Benchmarking and savings claims stall when the owner can't assemble one consistent record for the whole building. The Canada Green Building Council identifies standardized whole-building energy data as a foundational gap for benchmarking, emissions verification and sustainable-finance assessments. Before choosing controls or reporting a saving, establish how each meter relates to the utility account and to the loads inside the property.
The Natural Resources Canada energy management guidelines recommend documenting bills and meter readings, accounting for purchased and on-site energy sources, and building a baseline from at least two years of data. The same discipline helps a property team distinguish tenant allocation from whole-building performance.
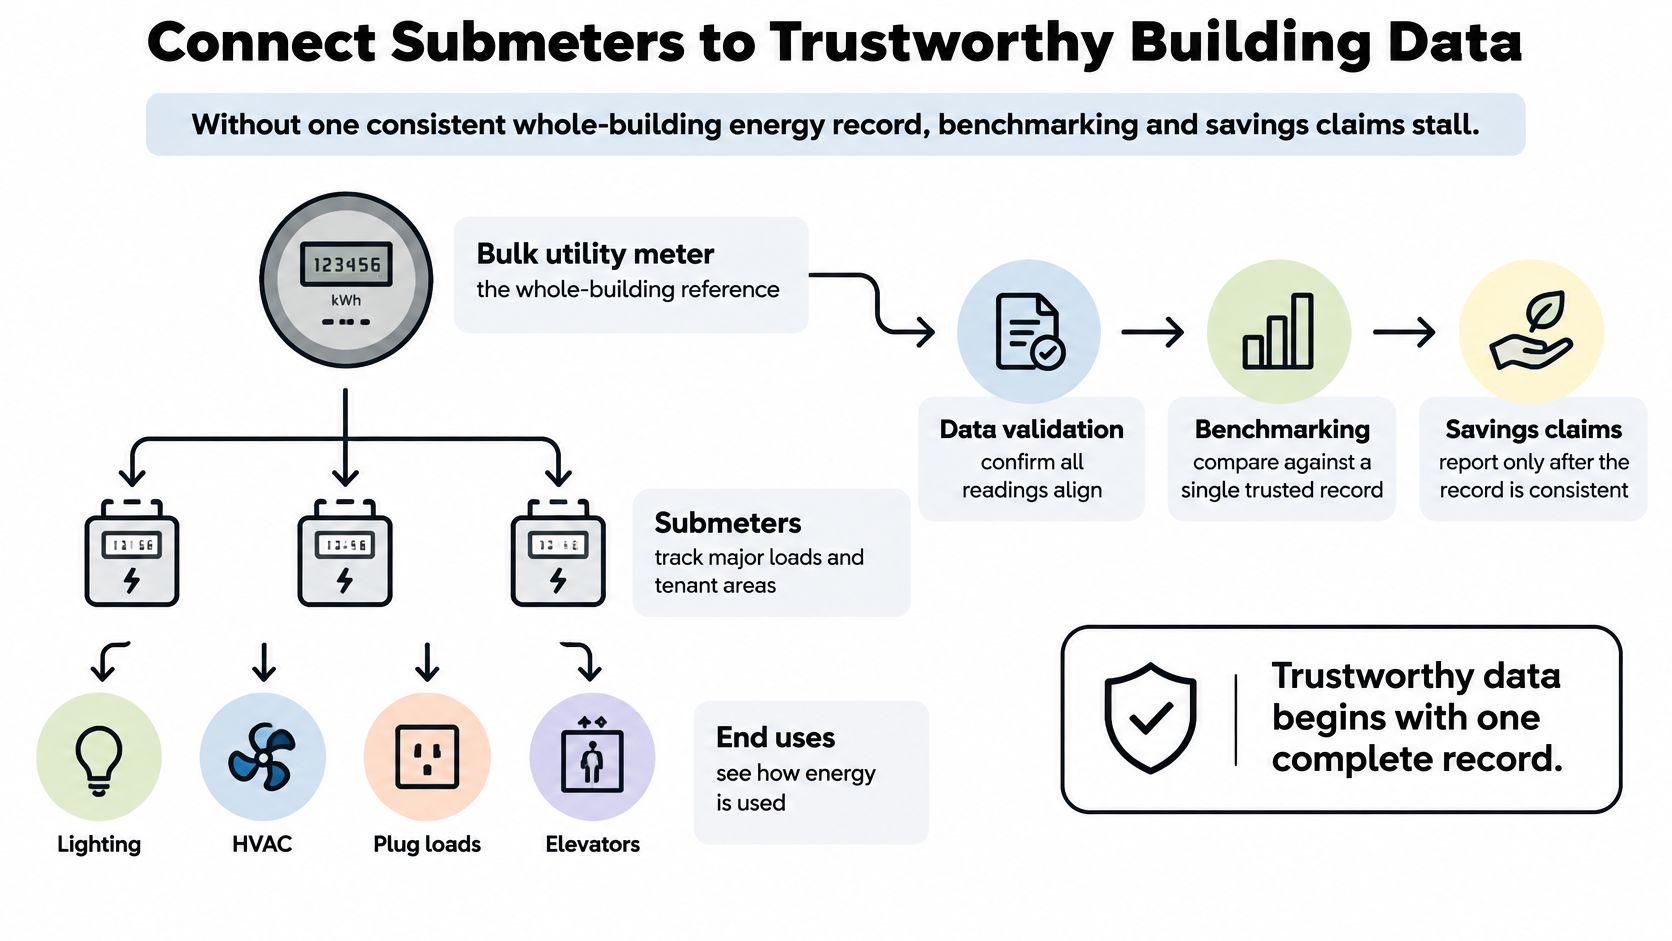
Build the meter hierarchy
Level
What it measures
Read type
Data owner
Interval
Bulk utility meter
Whole-site electricity, gas, steam or water on the invoice
Measured by utility
Account holder
Monthly bill, interval where offered
Common-area meter
Lobbies, corridors, parking and amenities
Measured or estimated
Owner
Interval where installed
Suite meters
Each suite's electricity or heat
Measured
Owner or billing agent
Monthly or interval
Branch meters
Domestic water or thermal loops for fan coils, hydronic heat or VRF
Measured or estimated
Owner or mechanical contractor
Interval where installed
For every level, record whether reads are measured or estimated, who maintains the data, and how frequently readings are available. Then reconcile the suite totals and common-area load against the utility invoice each month. If the totals don't align, treat the difference as a data-quality issue to investigate before it becomes a billing dispute.
Use the hierarchy to describe what each meter can prove. Suite readings can support billing and help identify unusual use, but they aren't a public ranking of residents. Common-area readings show the shared loads separately, which makes it easier to tell whether a change came from a suite or from lobbies, parking or amenities. For an overview of how connected meter networks collect and communicate readings, see this explanation of advanced metering infrastructure.
Set rules for interpreting changes
Number the following checks and assign an owner for each:
- List every energy source. Record electricity, gas, steam, water and thermal energy in physical and cost units so no carrier disappears from the picture. The usual slip is an electricity-only inventory.
- Gather a usable history. Collect monthly records covering at least 24 months, and use interval data when it's available. One unusually mild or cold season can distort a comparison.
- Create a normalized baseline. Adjust the reference for weather and operating conditions so a change in use isn't mistaken for better performance. An unadjusted utility bill doesn't make a fair baseline.
- Identify significant energy uses. Separate suites, common areas, domestic hot water, HVAC and central plant loads. The common slip is treating tenant allocation as proof of building-wide improvement.
- Assign owners and controls. Give each significant use a responsible person, operating controls, a target and an action plan. A target without an owner is easy to ignore.
- Review performance regularly. Use dashboards and management reviews to spot deviations and correct them. Waiting until the season ends can leave an operating problem in place for months.
A useful test this month is simple: check whether suite and common-area readings reconcile with the bulk invoice. If a retrofit, vacancy change or fuel switch alters the building, revisit the baseline. Otherwise, an old reference can hide a real improvement or make a normal change look like a saving.
KPIs for a Multifamily Energy Management System
KPI
What to record
Canadian reference
Review
Site energy use intensity
Gigajoules per square metre of floor area
Median 1.1 GJ/m² across 30,500 benchmarked buildings
Monthly and annual
Source energy use intensity
Upstream energy per square metre
Median 1.3 GJ/m²
Annual
Electricity share
Percent of reported energy
51%
Monthly
Natural gas share
Percent of reported energy
40%
Monthly
Carrier coverage
Electricity, gas and any steam, water or thermal in one inventory
Multi-carrier, not electricity alone
At setup
Suite versus common split
Percent of metered load in suites versus lobbies, corridors, parking and amenities
Building-specific, no national median
Monthly
Comfort check
Indoor temperature band plus heating or cooling complaint count
Hold comfort while energy falls
Monthly in heating season
The benchmarks above come from Natural Resources Canada's existing-buildings energy efficiency information. Its national benchmarking population covers 30,500 buildings representing 380 million square metres of floor area. The national medians offer a reference point, not a pass-or-fail grade for an individual apartment building.
Read a high result as a question
If a property's weather-adjusted site intensity sits well above 1.1 GJ/m², investigate heating and shared areas before blaming residents. Check whether the floor area is recorded correctly, whether all energy carriers are included and whether a central plant serves spaces beyond the residential suites. A high figure is a prompt to investigate, not a verdict about tenant behaviour.
Site and source intensity answer different questions. Site intensity measures the energy delivered to the building. Source intensity accounts for energy used upstream to supply it. Their difference is a reminder that a property's electricity and gas use can't be treated as interchangeable units when comparing performance.
Electricity and natural gas are separate scorecard rows for a reason. Electricity accounted for 51% of reported consumption in the benchmark, and natural gas for 40%. Track steam, water and thermal energy too when they're part of the property's energy picture. For owners considering how building loads respond to grid events, this overview of demand response programmes provides useful context.
The national figures don't tell you how much energy goes to suites versus shared spaces. Build that split from the building's own meter records, and review it alongside the comfort pair: a defined indoor temperature band and a count of heating or cooling complaints. Neither metric is enough on its own; together, they help show whether consumption changed while conditions remained acceptable.
Start with three first-year KPIs: one intensity measure, one suite-versus-common split and one comfort measure. Keep the definitions stable so monthly reviews compare like with like.
How to Plan and Implement the System
A building can have complete utility bills and still lack a clear picture of where energy goes. Suite meters, common-area loads and central systems may sit in separate records, like pieces of a map that do not line up. The Canada Green Building Council has identified consistent, standardized whole-building energy data as a barrier to benchmarking, emissions verification and credible financing assessments. A CAGBC discussion of the data gap and building performance underscores why intensity alone cannot establish operating savings.
Follow the sequence
Use the earlier checklist to set consistent rules for interpreting changes. Then turn those rules into a practical implementation sequence:
- Map the meter hierarchy. Connect each available reading to a suite, common area, central plant or utility account. Mark gaps and unclear unit assignments so the team knows which parts of the building the records represent.
- Reconcile the records before selecting software. Bring bills and meter data into one working record, and identify readings that are measured, estimated or missing. A platform can organize the information, but it cannot resolve an unclear meter map on its own.
- Choose the first operational question. For example, decide whether the immediate need is to understand suite and common-area use, review a central system, or allocate utility costs. That choice helps the property team define which readings need to be connected first.
- Assign responsibility for maintaining the record. Name who updates unit assignments, checks incoming data and follows up on gaps. Without a clear owner, changes in occupancy or meter configuration can make comparisons harder to interpret.
For homes, energy management often focuses on individual household use and practical operating choices. That differs from a multifamily building, where the records must also bring shared systems and tenant information together. An overview of home energy management for Queensland households offers a household-level comparison.
Use a 90-day starter
In the first phase, gather the available bills and meter records, then map them to suites, common areas and mechanical systems. Next, mark which readings are measured, estimated or missing, and assign an owner to each record. Finish by agreeing how often the property team will review the information and what question it needs to answer first.
Keep the sequence intact. A software platform can make records easier to display, but the first useful outcome is a building map that shows what each reading represents.
Measure Comfort Alongside Every Savings Claim
A heating control can lower use by delivering less heat. That isn't an acceptable saving if bedrooms become uncomfortable. The property team needs a comfort record alongside the energy record before it changes schedules, resets controls or reports results.
Choose representative suites across the building's exposures, including corner units, and place temperature loggers where they capture occupied-room conditions. Agree on an acceptable indoor temperature band with the owner, then record heating complaints by suite and week. Pair those readings with outdoor temperature and heating degree days, so a colder spell isn't mistaken for a control failure.
Compare conditions before and after a control change across similar weather. If the building has different orientations or heating zones, don't assume one logger represents every suite. A few consistently chosen locations, clearly documented, make a more useful comparison than ad hoc readings taken only after a complaint.
Track the energy carrier that changes
For a gas-heated building, check the gas meter when evaluating heating changes. For an electrically heated building or one using heat pumps, track electricity use and winter peak demand as well as monthly kilowatt-hours. A control can shift when electricity is drawn without producing a clear change in the monthly total.
Judge supervisory controls that adjust temperatures using predicted occupancy by three results together: energy use, comfort conditions and peak load. If consumption falls but complaints increase, the team hasn't demonstrated a comfort-preserving improvement. If comfort holds while use declines, document the meter, weather conditions and operating changes that support the result.
Comfort rule: A savings claim should include the temperature record and complaint count, not just the bill.
Prove Savings Without Cutting Comfort
A warm winter can make a gas bill look better even when the building's operation hasn't changed. Before celebrating, compare heating use under similar weather conditions and check whether residents remained comfortable. The table shows common signs that a reported saving may have another explanation.
What you see
Likely cause
Check before reporting
Gas use down after a mild winter
Weather, not operations
Normalize with heating degree days
Energy down and heating complaints up
Comfort was cut
Restore the temperature band and recount complaints
Suite total down, house meter flat
Cost was reallocated
Report suite and common area separately
Utility bill and submeters do not match
Estimated read or data gap
Reconcile and fill the interval before any claim
Intensity jumps after a retrofit
Old baseline still in use
Document the change and rebuild the baseline
If gas use falls, normalize for heating degree days before attributing the change to operations. If energy falls while complaints rise, the result may reflect reduced comfort; restore the agreed temperature band and check the readings again. If suite totals fall while the house meter stays flat, the building may have shifted where costs are allocated rather than used less energy.
Stop a claim when the utility invoice and submeters don't agree. Find estimated or missing reads and reconcile the records first. After a retrofit, review whether the baseline still represents the building's systems and operation, then document and rebuild it if the change makes the old reference unreliable.
Set expectations with evidence
Natural Resources Canada's guidance on the ISO 50001 energy management standard reports that Canadian companies implementing ISO 50001 achieved an average cumulative energy-performance improvement of nearly 10% within the first two years. For large Canadian companies, those improvements translated into energy-cost savings of up to $2 million annually. Those results show the value of measured, accountable management, but they aren't a forecast for a particular multifamily property.
The same guidance cites Clean Energy Ministerial estimates that energy management systems can save up to 30% of total energy use in industry and up to 40% in commercial buildings. Those are upper-potential estimates, not guaranteed outcomes for a rental building. For another perspective on estimating household costs, this Phoenix home energy cost estimator can help readers think about how assumptions shape an estimate; it doesn't replace a building-specific baseline.
Owners who want to reduce electricity use can also review this practical overview of electricity consumption reduction. Whatever the project, report the result only after checking weather, occupancy, comfort, meter completeness and baseline suitability.
No savings number goes to ownership until weather, occupancy and comfort sit on the same page as the meter.
Book a Building Assessment Before You Specify Software
Choose the next step based on the quality of the building's records. If bulk bills can't be split into suites, common areas, water and thermal use, prioritise measurement. If the split reconciles to the invoice and heating is the significant load, focus the next investment on controls that maintain comfort. If the baseline is too short or a retrofit has just changed the building, wait until you can rebuild a usable comparison.
If staff don't have the capacity to manage meter design, installation, resident billing and ongoing validation, a turnkey submetering partner can provide the measurement path. Axis Meter Solutions provides submetering for multi-family, commercial and mixed-use properties, including equipment, installation, billing, maintenance and project-specific compliance planning. Its work can include property and existing-system assessment, meter selection and system-design coordination, commissioning and data validation, recurring resident or tenant billing, move-in and move-out support, and ongoing monitoring.

For thermal systems, the building's HVAC layout matters. Axis assesses the existing configuration and designs a thermal metering solution for applications such as hydronic systems, fan coils and variable refrigerant flow. Axis Meter Solutions Inc. is licensed by the Ontario Energy Board as a unit sub-meter provider for electricity unit sub-metering services in Ontario under licence ES-2022-0268; confirm applicable provincial requirements before engaging a provider.
Bring 24 months of utility bills and one practical question to an assessment: how much of the building's load sits in suites versus common areas? That answer helps determine whether the next step is better measurement, a control change or a more reliable baseline.
Axis Meter Solutions provides turnkey submetering for multifamily, commercial and mixed-use buildings, from meter assessment and installation through data validation, tenant billing and ongoing support. If your building's bulk bills don't show how suites and shared spaces use energy, visit Axis Meter Solutions to discuss a building-specific assessment.
Ready to Optimize Your Utility Management?
Tell us about the property, utility, number of units, and your billing or monitoring goals. We'll help you identify the right next step.
Book a Call