Smart Building Technology: Systems, Data and Integration

At its CanmetENERGY facility in Varennes, Quebec, an automated model-predictive control strategy in Natural Resources Canada CanmetENERGY research reduced natural-gas consumption and associated greenhouse-gas emissions by 22% while maintaining occupant comfort and producing similar electricity costs. That result reframes smart building technology. The gain didn't come from a sensor count. It came from trustworthy interval data connected to control logic that could anticipate heating demand, respect indoor temperature limits, and prove the saving afterward.
That's the test for a multifamily or mixed-use owner. Can you trace each number to its meter, use it to run equipment better, and defend it when a tenant questions a bill? If you can't, you've bought devices, not intelligence.
Table of Contents
- Five Technology Layers and What Each Does
- How the Layers Connect in One Building
- Where Multifamily and Mixed-Use Buildings Gain Most
- Measured Results and What Makes Them Hold
- Data Ownership, Accuracy and Billing Readiness
- Cybersecurity, Service Dependency and Interoperability Risks
- Confirm Your Integration Plan Before You Commit
Five Technology Layers and What Each Does
A smart building technology is any sensor, controller or software layer that measures building loads and turns the readings into decisions a manager can act on. Owners get confused because vendors sell these layers as one product. They're not. Each one answers a different question, and a weak answer in one layer limits the value of the others.
The Five Layers at a Glance
Technology
What It Measures or Controls
Main Job in a Multifamily Building
Output the Owner Sees
IoT sensors
Temperature, humidity, occupancy, water flow and leaks
Early leak alerts and room-condition checks
Time-stamped readings and alerts
Building management system (BMS)
HVAC, lighting, pumps and fans
Scheduling and control of plant equipment
Equipment status, setpoints and alarms
Energy management system (EMS)
Whole-building energy use across main meters
Tracking consumption against baselines
Interval energy data and dashboards
Submetering
Electricity, water, gas and thermal use per unit
Allocating costs to tenants and separating common-area loads
Unit-level readings for billing
Analytics platforms
Combined data from all other layers
Flagging faults and benchmarking performance
Fault reports, benchmarks and summaries
Read the last column first. That's what lands on your desk. A sensor that produces readings nobody reviews doesn't prevent damage. A dashboard that can't separate suite use from lobby, hallway, parking and amenity loads doesn't support billing. A BMS alarm that doesn't name the failed pump or the drifted setpoint doesn't shorten a service call.
Lighting shows the distinction well. Occupancy and daylight sensors notice conditions, the control system dims or switches fixtures, and the EMS shows whether common-area electricity fell. For a closer look at that control layer, see the lighting insights from Access Electrical and Lighting. Notice what's missing from that chain. None of it, on its own, tells you how much electricity Suite 804 used.
How to Use This Map
Most buildings need several rows working together before any single row delivers value. Sensors without analytics create noise. Analytics without submetering can't allocate costs. A BMS without an EMS can run equipment on schedule while whole-building consumption steadily climbs.
Keep the table beside any proposal you receive. For each quoted item, write which row it belongs in, which load it measures or controls, and what output you'll see each month. If a proposal fills one row heavily and leaves the others vague, you don't have an integrated system yet. You have a partial one, and you should price and judge it that way.
How the Layers Connect in One Building
Think of the building as a body. Sensors are the nerve endings that notice a change. The BMS is the reflex that responds. Submetering is the bill that shows who used what. Analytics is the doctor who reads the full chart, compares it with last season, and tells you whether this is a one-off event or a pattern.
The analogy matters because each part fails differently. Nerve endings can report a problem they can't fix. A reflex can act without explaining the cost. A bill can allocate a cost precisely without telling you the equipment is failing. A doctor working from an incomplete chart gives confident, wrong advice.
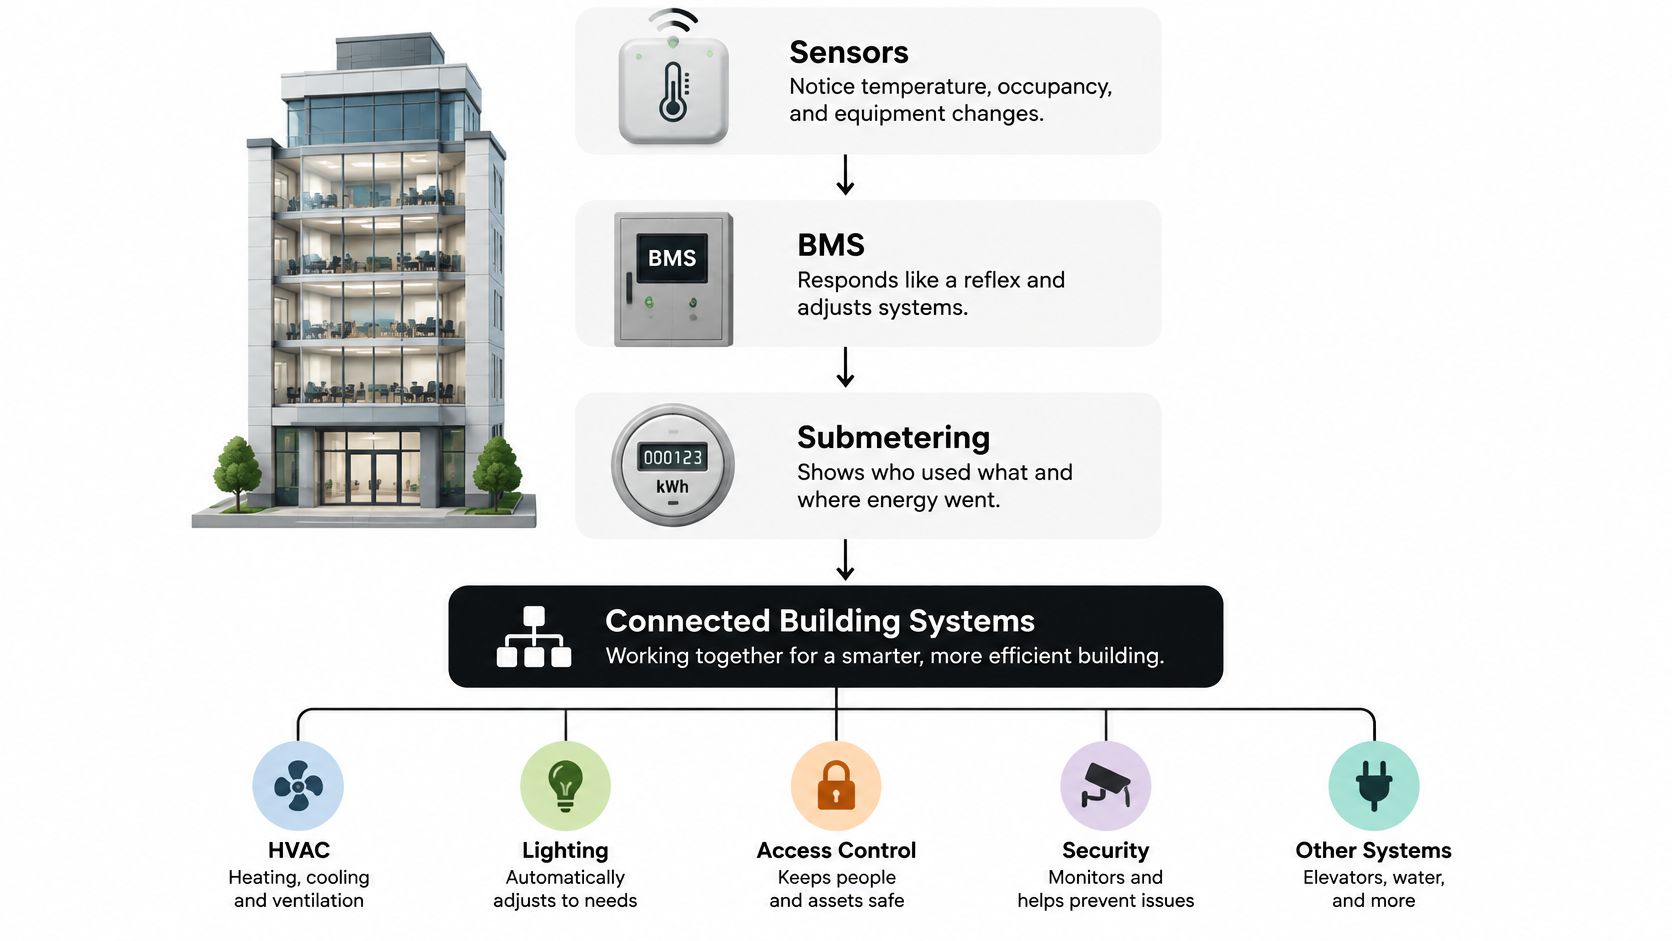
One Leak, Four Layers
Say a water sensor in a mechanical room detects rising flow at 2 a.m. when suites should be quiet. The first job is speed. The alert reaches the manager's phone, the event is time-stamped, and staff can check the room before water reaches the floor below. We pair water consumption monitoring with dedicated leak sensors in mechanical rooms, suites and other high-risk locations for faster alerts, and owners can review that status from anywhere.
Next, the submeter answers the location question. Is the increase in one suite, perhaps a running toilet, or is it in a common-area line feeding a laundry room? That distinction decides who gets called, who gets billed, and whether you're chasing a fixture repair or a piping fault. Finally, analytics logs the event against the building's normal overnight flow, so next month's summary shows duration, estimated volume and whether similar spikes have happened before.
The communications path behind those readings matters as much as the meter itself, which is why it's worth understanding how advanced metering infrastructure moves meter data before you compare hardware. We collect water meter readings remotely without entering every suite, with the communications design matched to the building, meter outputs and reporting needs.
A smart building is only as useful as the data it can trust.
Where the Chain Breaks
A BMS can control equipment without any tenant-level metering, but it cannot tell a tenant's share of a load from a shared one. It knows the boiler ran longer. It doesn't know which suites drew the heat. Conversely, submeters can allocate every unit precisely while the plant runs wastefully all night, because allocation isn't control.
Run this test on your current monthly summary. Pick any five numbers on it. Can you name the source of each one, the meter or sensor that produced it, the interval it covers, and which layer turned it into the figure you see? If you can't trace a number, don't use it to bill a tenant or approve a retrofit. Fix the chain at that link first.
Where Multifamily and Mixed-Use Buildings Gain Most
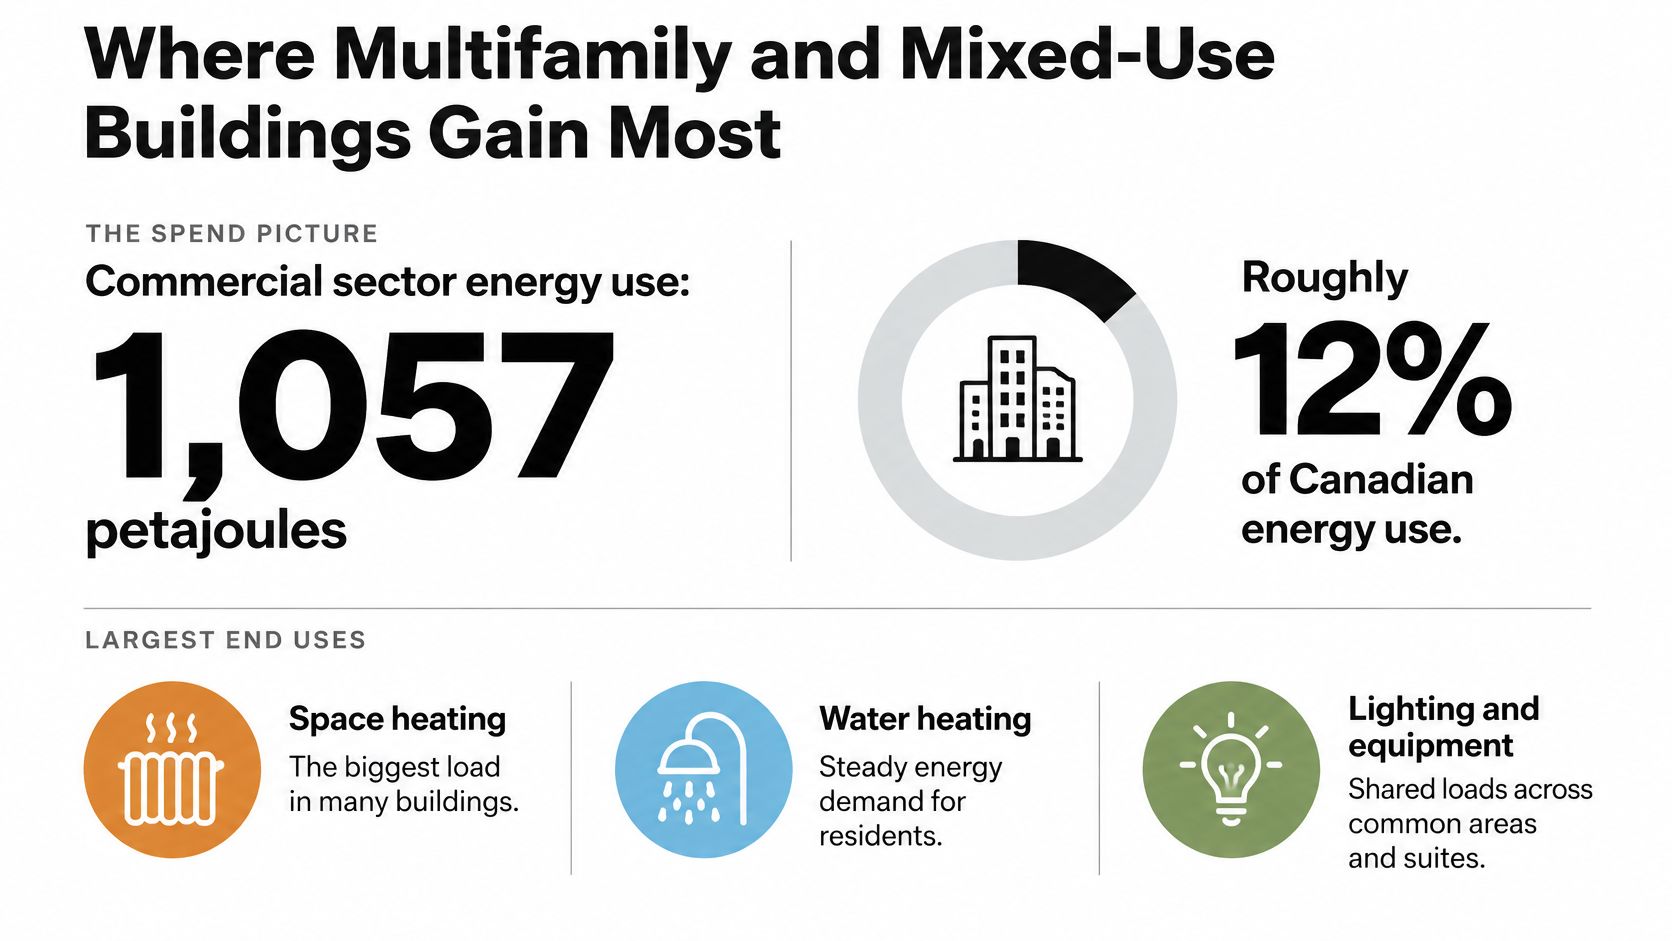
Start with the spend picture, not the catalogue. According to Natural Resources Canada guidance on existing buildings, Canada's commercial-building sector consumed approximately 1,057 petajoules of energy, about 12% of total Canadian energy use, and the sector grew by 22% between 1990 and 2010. The largest end uses were lighting, space heating and cooling, motors serving equipment such as elevators, and water heating.
Those four end uses map directly onto property types you already own. In older rental stock, space heating and water heating usually dominate, so thermal control and water monitoring carry the business case. In a condominium tower, common-area lighting, garage ventilation, elevator motors and amenity spaces are shared loads that suite meters alone will miss. In mixed-use buildings, a ground-floor restaurant's gas and water profile looks nothing like the residential floors above it, and blended billing hides that completely.
Existing Buildings Are the Main Event
That sector growth figure carries a practical lesson. The buildings that need better measurement mostly already stand and are occupied. You can't wait for new construction to fix portfolio performance, and you usually can't empty a building to retrofit it. Benchmarking, recommissioning and whole-building retrofits are the tools for this stock, in that order: measure, tune what exists, then replace what's at end of life.
Retrofit feasibility is better than many owners assume. Water submeters can often be installed in an existing apartment building without rebuilding suites, particularly where each unit has accessible supply lines. Thermal metering needs a look at the actual hydronic, fan-coil or VRF configuration first. The constraint is usually piping layout and access scheduling, not the meter technology itself.
Comparison data has also improved. Canada's national benchmarking dataset through ENERGY STAR Portfolio Manager grew from 6,100 buildings in 2013 to 30,500 buildings in 2022, according to Natural Resources Canada benchmarking data snapshots, covering 380 million square metres of floor area with multifamily properties representing 18% of participating buildings. Treat that dataset as a peer reference, not a census, since participation is self-reported. It still lets you ask a useful question: does my building use more energy per square metre than similar Canadian buildings, and if so, in which end use?
Run the Ranking Exercise
Pull the last twelve months of utility bills before you talk to any vendor. Then do three things:
- List the three largest end uses: Rank heating, water heating, common-area electricity, suite electricity, water and sewer, and cooling by annual cost, not by guesswork.
- Match each load to a layer: Pair each of the top three with the technology from the five-layer table that measures or controls it.
- Mark what you cannot see: Note any top-three load you currently can't separate by suite, by common area, or by time of day.
That marked-up list is your specification. It tells you which layers you need, in which order, and it stops a salesperson from leading with whatever they happen to stock.
Measured Results and What Makes Them Hold
Two Canadian results are worth knowing because both report conditions, not just percentages. The Varennes facility used model-predictive heating control, where the system looks ahead at weather and thermal demand instead of reacting after rooms cool down. The Ottawa pilot used visibility, a central database and dashboards that let operators spot abnormal loads and correct schedules.
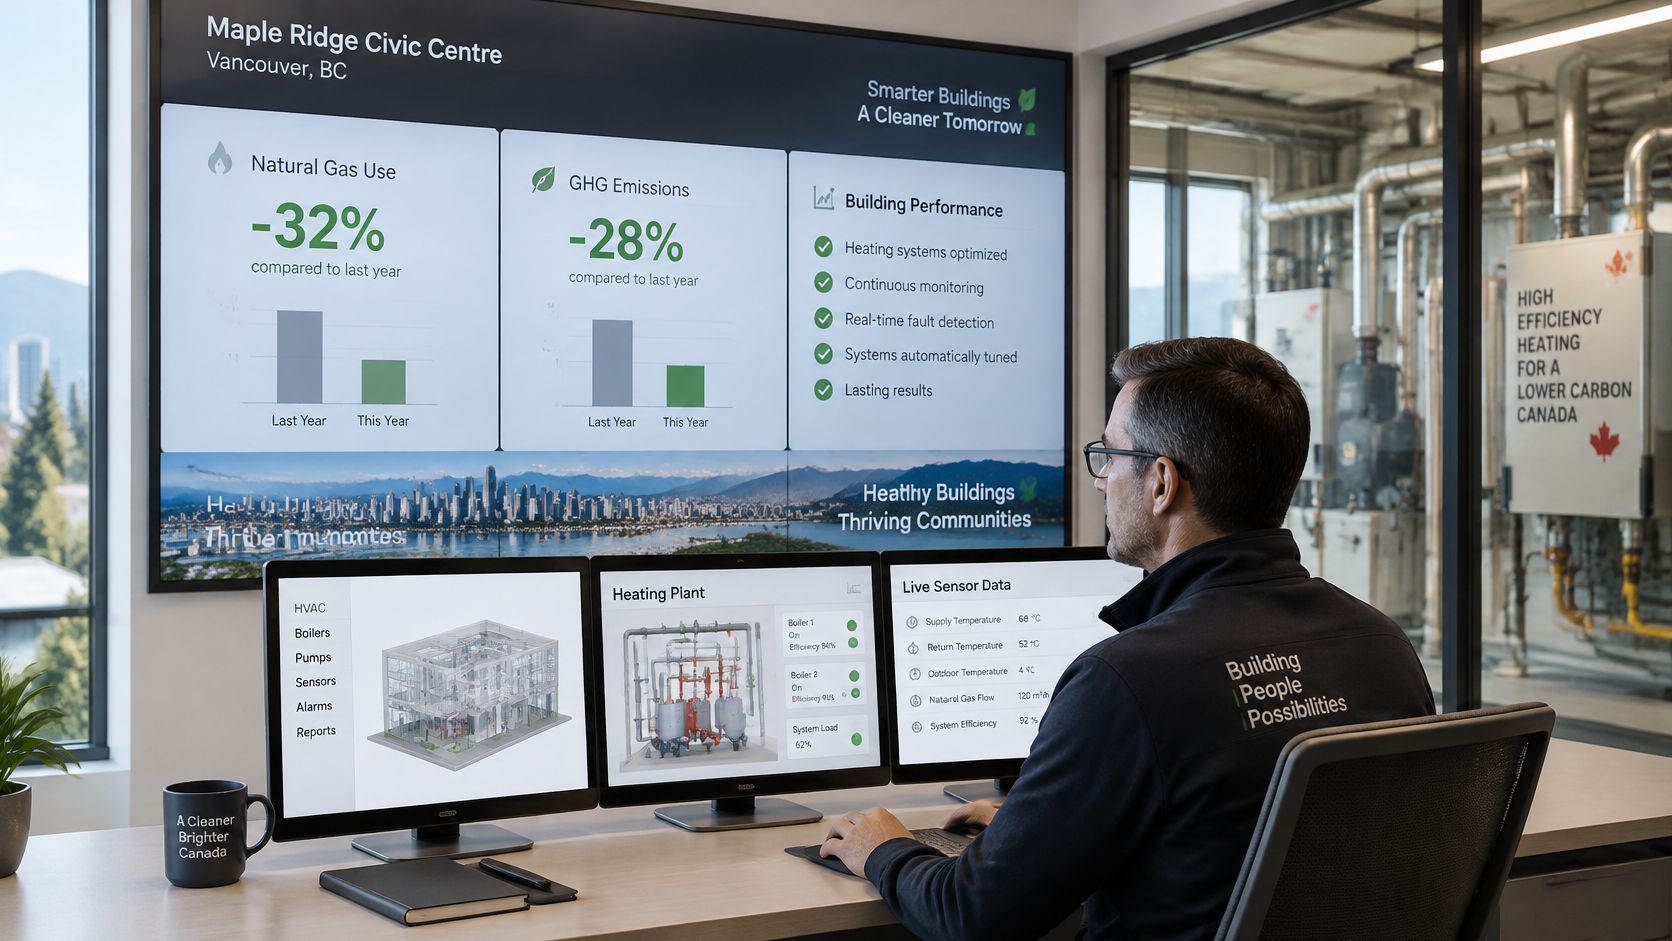
In the federal pilot, four Ottawa-area government buildings reduced energy consumption by an average of 15%, equivalent to 660 tonnes of greenhouse-gas emissions in one year, after deploying a customised Energy Management Information System described in Natural Resources Canada best practices for commercial buildings. The mechanism was diagnostic as much as automated. Continuously visible data let operators compare actual performance with expected baselines and act.
Setting
Approach
Reported Result
Condition Behind the Result
CanmetENERGY, Varennes, Quebec
Model-predictive heating control
22% less natural gas and related emissions, similar electricity cost
Comfort maintained; automated control of heating
Four Ottawa-area federal buildings
Energy management information system with dashboards
15% average energy reduction; about 660 tonnes of GHG emissions avoided in one year
Customised system, central database, real-time monitoring
Benchmarking against similar buildings
Comparing consumption with peer buildings
Flags outliers for retrofit priority
Self-reported data, not a random sample
The Sequence That Makes Results Repeatable
Results hold when the sequence is right. First, set reliable whole-building and end-use baselines from historical data. Second, treat indoor temperature limits as control constraints, not complaints to handle afterward. Third, add predictive staging of boilers, pumps and setpoints. Fourth, set alarms with thresholds a named person can act on. If you'd like the EMS side explained in more depth, our overview of what an energy management system does covers the baseline and alarm logic.
Two technical habits separate credible claims from lucky ones. Normalise for weather and occupancy, because a mild January will happily take credit for your new controls. And retain interval data long enough to distinguish seasonal swings from persistent faults, because a valve that leaks heat every shoulder season looks like weather until you have two years of data side by side.
The following walkthrough shows how operators use live performance data day to day.
Whether a result holds depends on building type, controls quality, commissioning, operator response and data completeness. Treat both Canadian figures as planning benchmarks, not guaranteed savings rates. Ask any provider one question before you discuss price: which baseline does your savings claim use, and how will we both see it?
Data Ownership, Accuracy and Billing Readiness
Most smart building content treats data collection as an automatic benefit. Canadian consultation evidence says otherwise. In Natural Resources Canada's technical report on what it heard from stakeholders, stakeholders repeatedly identified a lack of accessible, accurate building-energy data, and inconsistent reporting frequency and detail, as a major barrier to investment. The Canada Green Building Council likewise says standardised whole-building energy data is needed to benchmark performance and validate emissions reductions.
Sit with that for a moment. The barrier isn't a shortage of sensors. It's data that owners can't access, can't compare, or can't trust. Adding devices to a building with no data rules produces more of exactly that problem, plus a larger monthly fee.
The Questions Owners Rarely Get Answered
Before you sign, you need written answers to questions most proposals skip. How do interval meter data, common-area consumption, tenant records and building automation data reconcile with each other, and who checks when they disagree? Who can access the full historical record after a technology provider changes, and in what file format? How do you preserve an auditable record for a billing dispute, an energy audit, or a capital plan five years from now?
Contrarian note: More sensors do not automatically create more intelligence. Unstructured data mostly creates more administration.
Four Fixes That Make Data Usable
Standard naming comes first. Every meter and sensor point needs a name that says where it is and what it measures, applied consistently across the portfolio. Without it, nobody can tell whether "Meter 14" is a suite, a riser or a laundry room, and portfolio comparisons collapse.
Consistent time intervals come second. If one system reports hourly, another daily and a third whenever it reconnects, you can't align a consumption spike with an equipment event. Agree the interval per data type in the contract, and require flags for missing or estimated intervals rather than silent gaps.
Routine data quality checks come third. Someone must review failed reads, stuck values, negative consumption and meters that drift, on a schedule, with a named owner. Automated checks catch most of this cheaply, but only if a person is accountable for the exception report.
Written ownership and export clauses come fourth. State that the building's consumption data belongs to the owner, define the export format, and set how quickly you receive the complete history if the agreement ends. This is also where billing readiness is decided, since tenant invoicing depends on records you can produce on demand. Our multifamily utility billing features show how unit-level records feed monthly invoicing and resident support.
Keep one distinction explicit throughout. Automation data supports operators. Tenant billing needs revenue-grade readings from approved meters, commissioned and documented. The two are not interchangeable, and conflating them is how owners end up defending a bill built on a sensor estimate.
Finish with a two-part test. Can the program produce a defensible unit-level allocation and a whole-building benchmark from the same dataset, without a spreadsheet in between? If it can't, the dashboards are decoration.
Cybersecurity, Service Dependency and Interoperability Risks
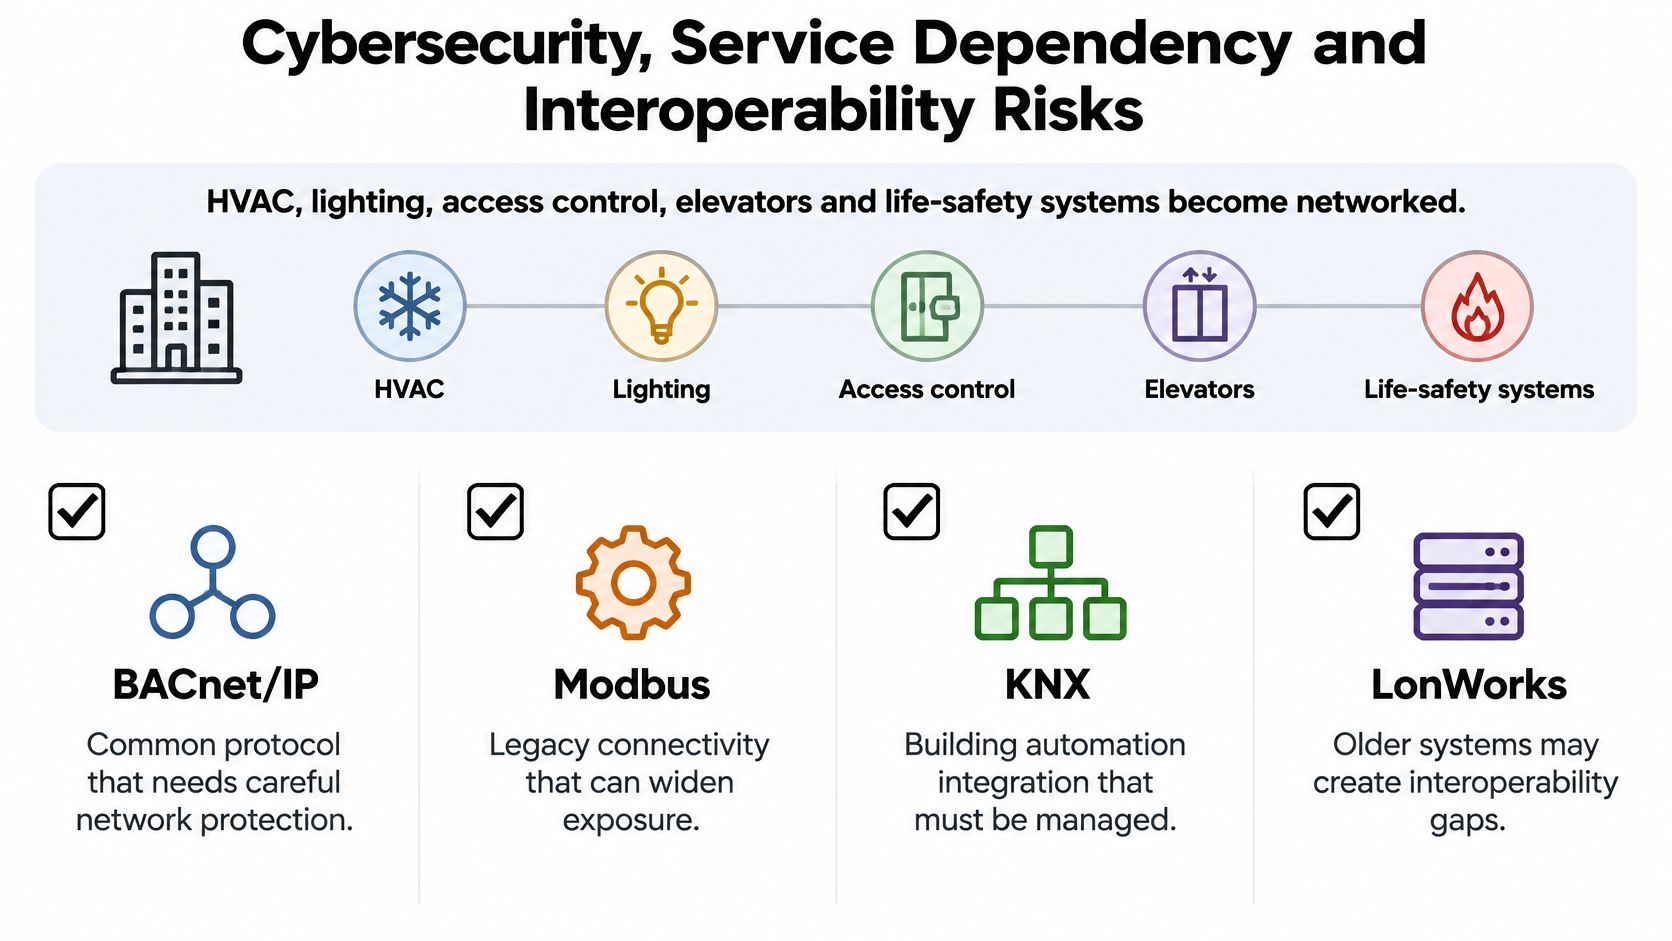
Here's the risk in plain terms. When HVAC, lighting, access control, elevators and life-safety systems become networked, each connection is both a convenience and a path in. A controller installed to save energy can also become the device an attacker reaches first, especially if it still carries a default password.
Common building protocols including BACnet/IP, Modbus, KNX and LonWorks were designed primarily for functionality rather than security, according to a 2025 Canadian operational-technology report, which recommends maintaining an inventory of controllers, protocols and vendor connections. These protocols are not defective. They were built for closed networks, and many buildings have since connected those networks to the internet for remote access without revisiting the assumptions underneath.
The Service Model Carries Its Own Risks
Security is only half the exposure. Technology-as-a-service models add third-party data collection, privacy and energy-security concerns, dependence on remote control, technical-skill requirements and the possibility that the provider stops service altogether. Workforce skills, high costs, uncertain returns and inconsistent data also recur as barriers for Canadian owners, not just hardware price.
Consider what happens in a provider-owned, long-term service model if the relationship ends badly. Who owns the meters on your walls? Can another firm read them? Do tenants keep getting bills during the transition? These aren't pessimistic questions. They're the questions that decide whether a twenty-year asset decision survives a five-year corporate change.
A Specification List You Can Copy
Carry these terms into any retrofit specification or request for proposal:
- Offline operating mode: Equipment keeps safe, scheduled control if the cloud connection drops.
- Credential management: Unique accounts, no shared logins, and prompt removal when staff or vendors change.
- Patch responsibilities: A named party, a defined cadence, and a record you can inspect.
- Incident notification: How quickly you're told, and what information you receive.
- Data export: Complete history, standard format, no ransom pricing at exit.
- Meter replacement rights: Who pays, who supplies, and whether a third party may service the meters.
- Commissioning records: As-built drawings, point lists, calibration and test results in your hands.
- Contract continuity: What happens to monitoring, billing and data if the provider fails or is acquired.
Comparing the Models
Open protocols reduce lock-in because multiple vendors can service the same controllers, but they put integration responsibility on you or your contractor. Documented APIs let your other systems read and write data, which matters when property management software needs consumption figures. Independent commissioning gives you a third party verifying that what was specified is what runs. A provider-owned long-term service model lowers upfront cost and day-to-day burden, but raises the stakes on exit terms, data export and replacement rights.
Smaller buildings face the same risks with less in-house expertise, which makes lock-in more costly, not less. A twelve-unit property has no IT department to renegotiate from strength. So close with the full-life test: will this system stay usable, billable, secure and maintainable across its entire asset life, under a different manager and possibly a different provider? If the honest answer depends on one vendor behaving well forever, rewrite the terms before you sign.
Confirm Your Integration Plan Before You Commit
Work through these six steps in order. Each one protects the step after it.
- Inventory what exists: List every meter, controller, network connection and vendor login in the building, because every later decision depends on what's already installed.
- Match layers to loads: Use your bill ranking to confirm which technology layers address your largest end uses, so no layer gets bought without a load behind it.
- Write the data rules first: Set naming, intervals, access rights and export format before anyone selects hardware, because retrofitting data rules is painful.
- Put security in the proposal request: Add the offline mode, credential, patching, incident and continuity terms to the request for proposal, not to a change order later.
- Get site assessments: Ask two or three providers to assess the building. With us, the first step is a quick form or a booked call where you share building size, number of units and current utility setup, followed by a free consultation assessing layout and current setup.
- Confirm jurisdiction before kickoff: We confirm availability, equipment approvals, installation requirements and tenant-billing rules for your jurisdiction before a project proceeds. Ask every provider to do the same, in writing.
You should walk away with a short shortlist of the layers your building needs, and three questions that decide between providers. Whose baseline will we measure against? Who owns and exports the data? What happens if you are no longer our provider?
If you're ready to find out which layers your building needs, Axis Meter Solutions offers a free consultation that assesses your layout, unit count and current utility setup, then recommends the right electricity, water, thermal or gas submetering for the property. Visit us to book that assessment and get billing-grade data you can trace, defend and keep.
Ready to Optimize Your Utility Management?
Tell us about the property, utility, number of units, and your billing or monitoring goals. We'll help you identify the right next step.
Book a Call